JFR (Java Flight Recorder) is a common JVM monitoring tool to help analyze the JVM usage status. For more details about JFR, you can search the internet.
Our JFR recording menu supports collecting and viewing diagnostic and profiling data of a running Java application, which usually aims to facilitate performance tuning.
It shares almost 95% of the features of the famous JProfiler. Moreover, developers can directly use our JFR recording menu online without the need to seek TS to switch on and off for concerns about system stability.
After choosing a node of the service, you can click Start JFR Recording to input the duration. Then the system will start recording JFR. When the recording is over, you will get a record file for further analysis.
Background
Previously, analyzing performance-related issues in the targeted environment was a tedious task. Tools like JProfiler need to be installed in the environment or service to scrape the data. Not only is the installation configuration cumbersome, but some environments (such as production) also do not allow the installation for stability. Starting with JDK 11, a free profiling tool is introduced: Java Flight Record (JFR). JFR can be utilized directly in the runtime environment without the necessity to modify the startup configuration in advance, and JFR’s impact on performance is very small (overheads of profile mode is less than 2%). The default functions of JFR and several InsureMO default extensions (JDBC and Rest API) can basically meet 99% of the requirements of performance analysis. ICS has built-in functions and related management interfaces.
UI Operation
We provide a web UI to simplify JFR-related operations.
Click Monitor > JFR Management in the menu. Then select the specified Microservice Name and the corresponding Microservice Node (IP and Port) to list the existing JFR records.
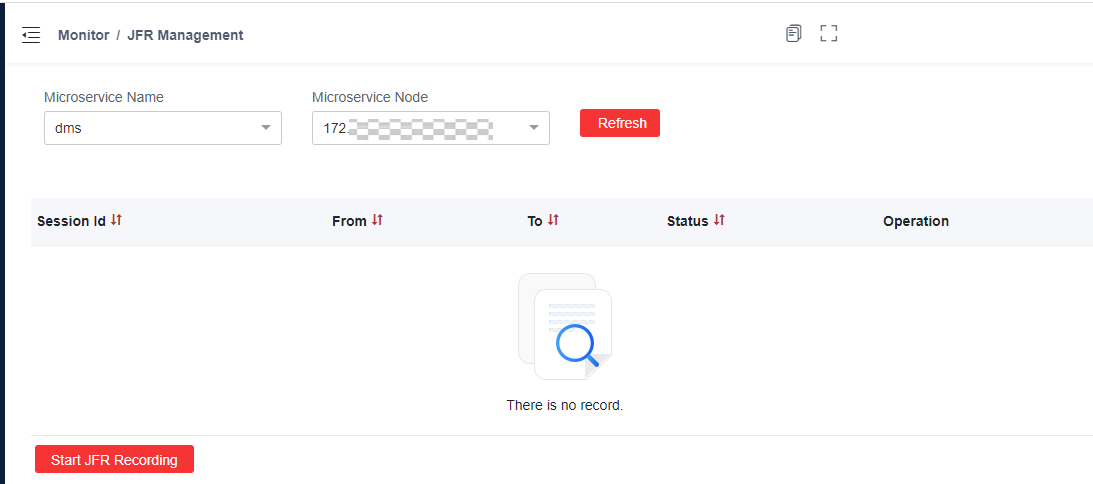
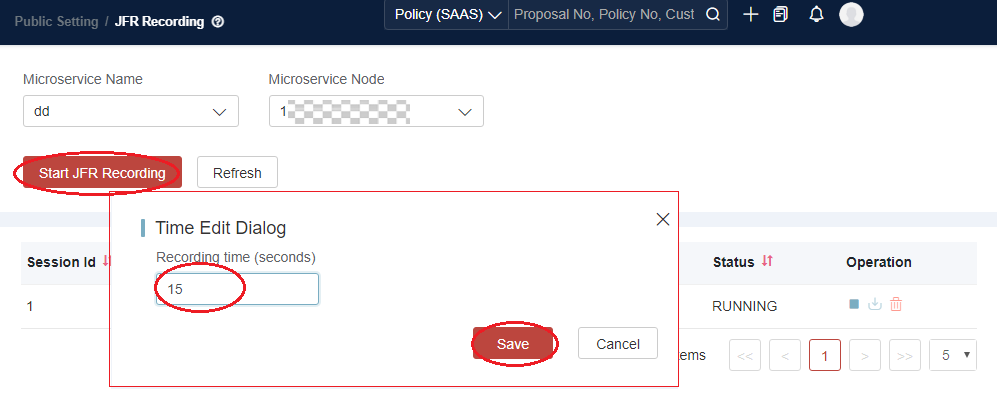
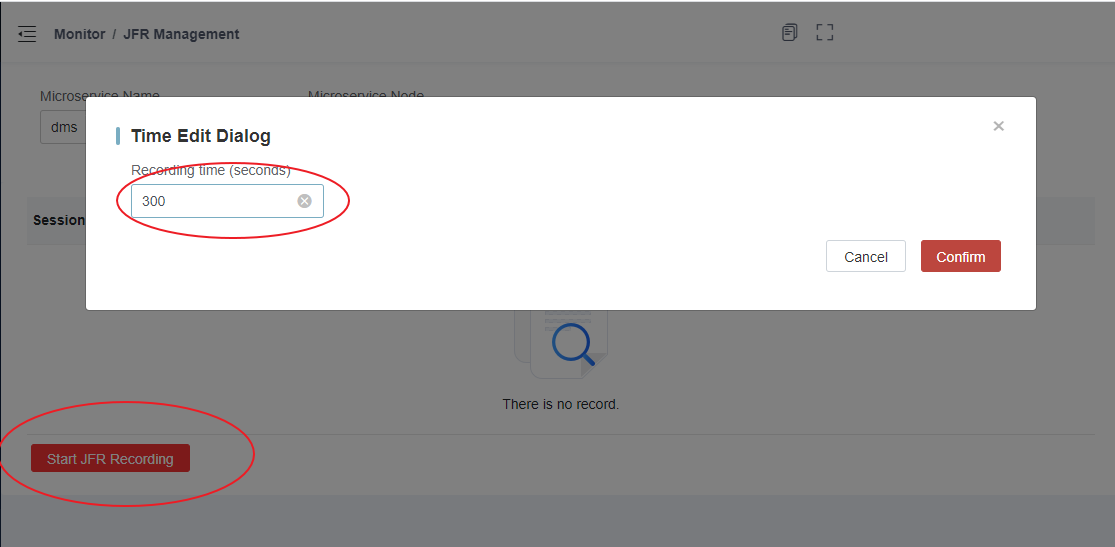
Click Start JFR Recording, and then define the duration of recording in a pop-up window. Click Confirm to start recording. JFR will stop recording automatically after the specified duration. You can also stop the operation manually.
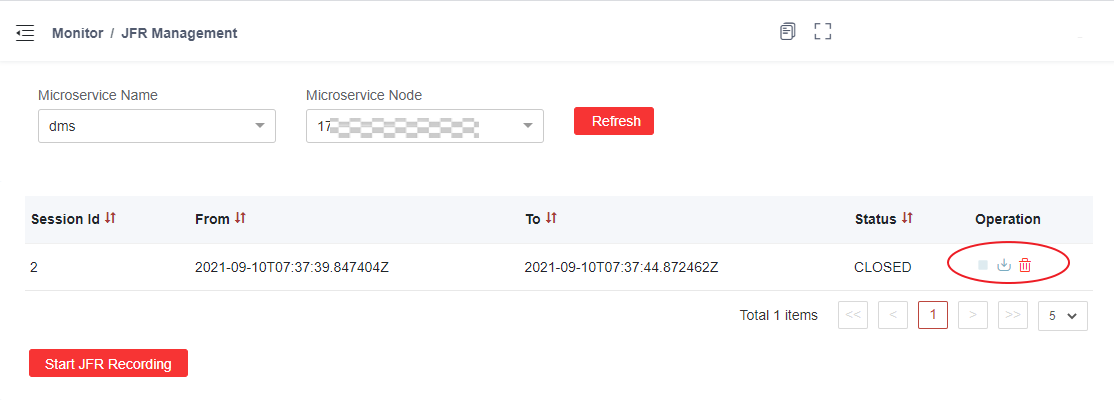
The Query Results page lists all JFR records in the instance. If the recording status is Running, you can click Stop to terminate the recording in advance. If the record status is Closed, you can download the JFR file, or delete the record (and delete the server-side JFR file).
JFR Analysis
Tools
To view the exported JFR files, you need to use two tools at the same time:
- JProfiler 11 or higher, mainly for viewing CPU-related performance information
- Java Mission Control 7.1 or above, mainly for viewing SQL access and Rest API calls
If the recording time is too short and the CPU data is not captured, JProfiler will report an error when opening the corresponding file.
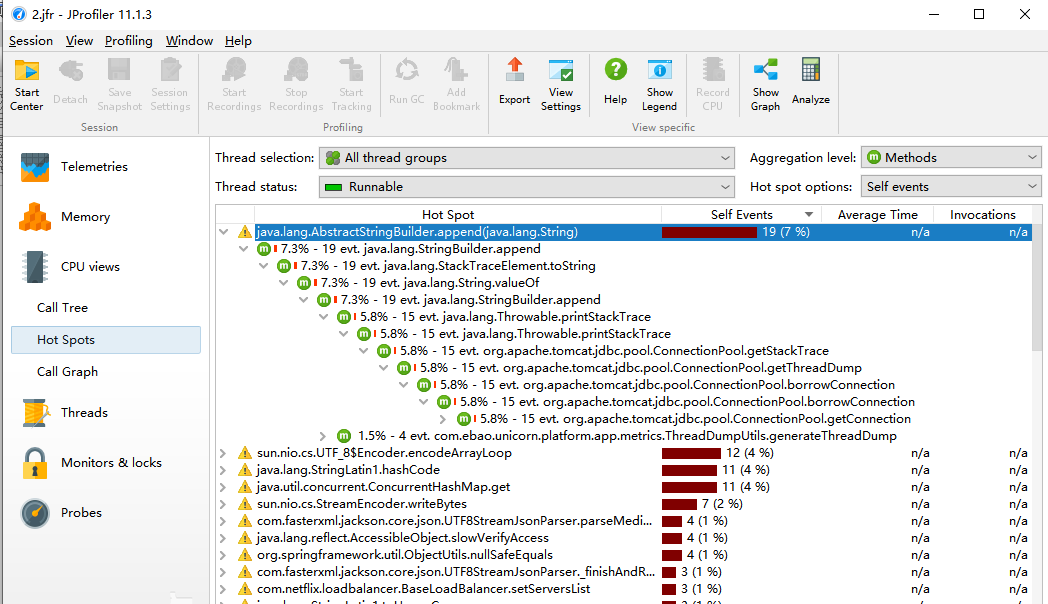
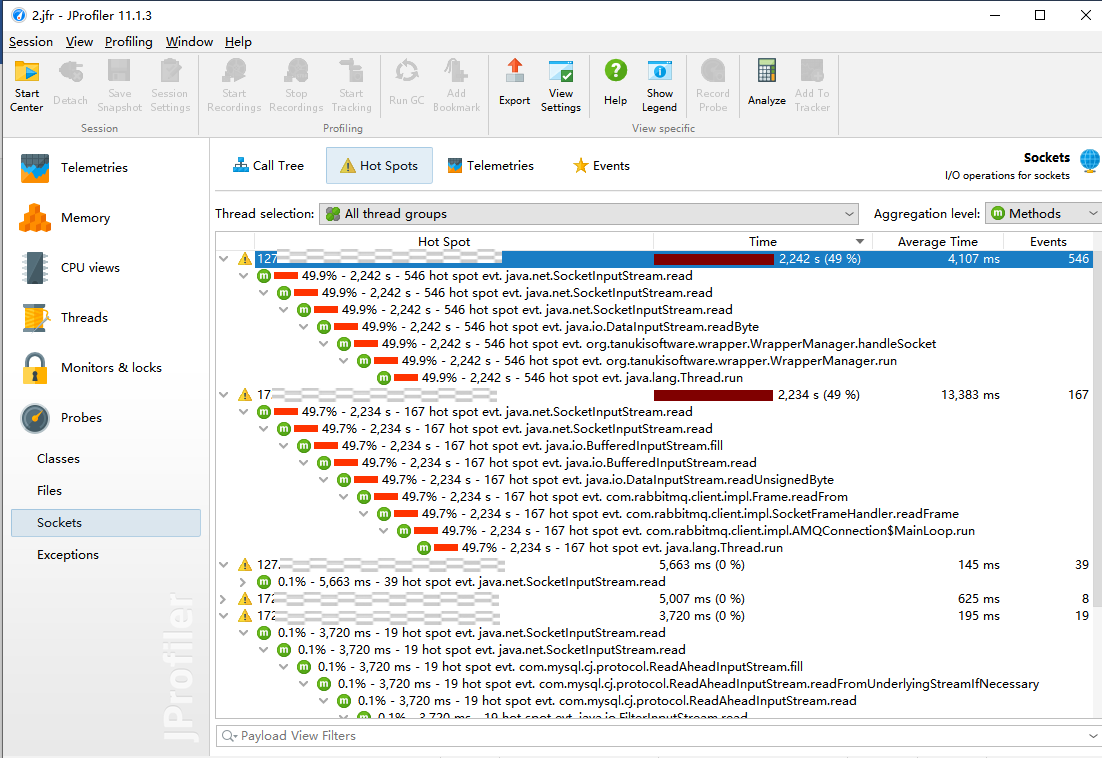
CPU Performance Data Analysis (JProfiler)
In JProfiler, click Hot Spots and Call Tree in CPU views.
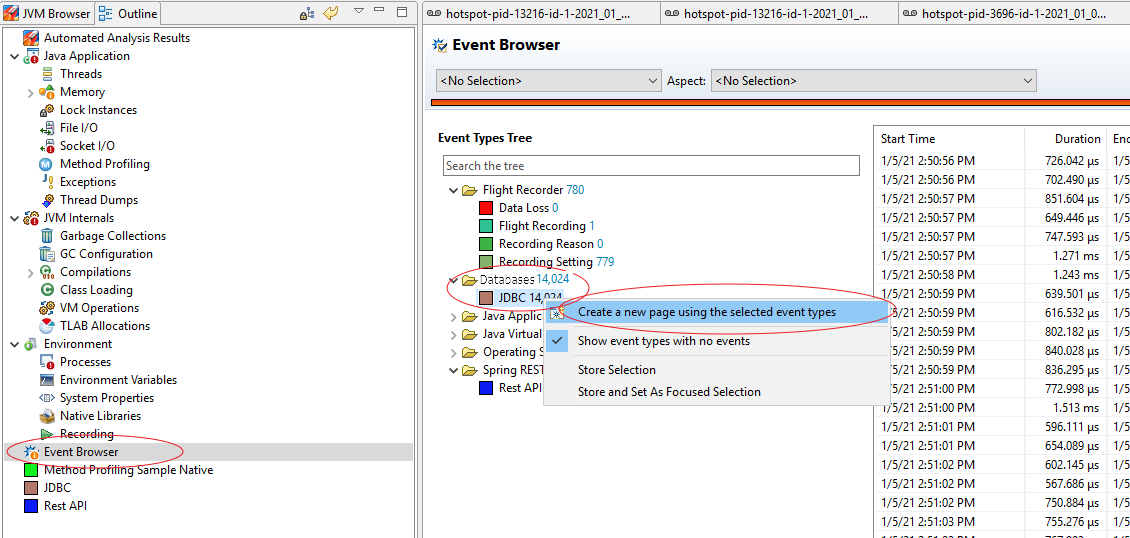
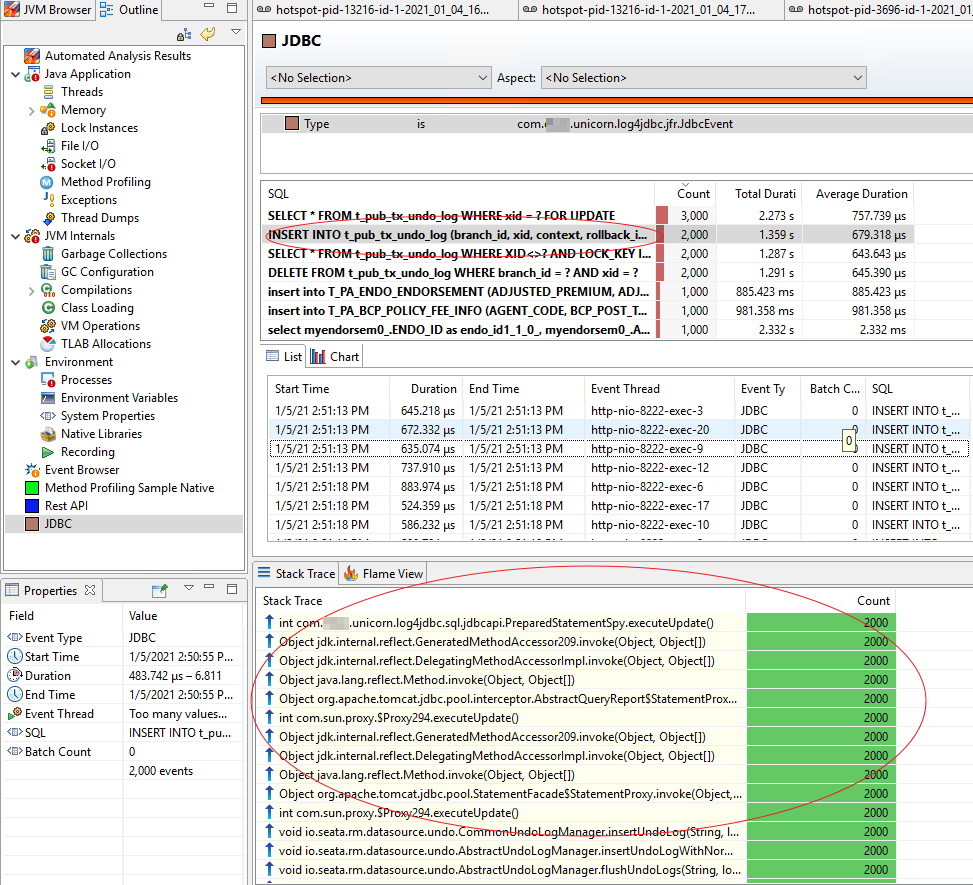
JDBC Data Analysis (JMC)
- Click Outline > Event Browser. Then find Databases > JDBC in Event Types Tree, and click Create a new page using the selected event types in the right-click menu.
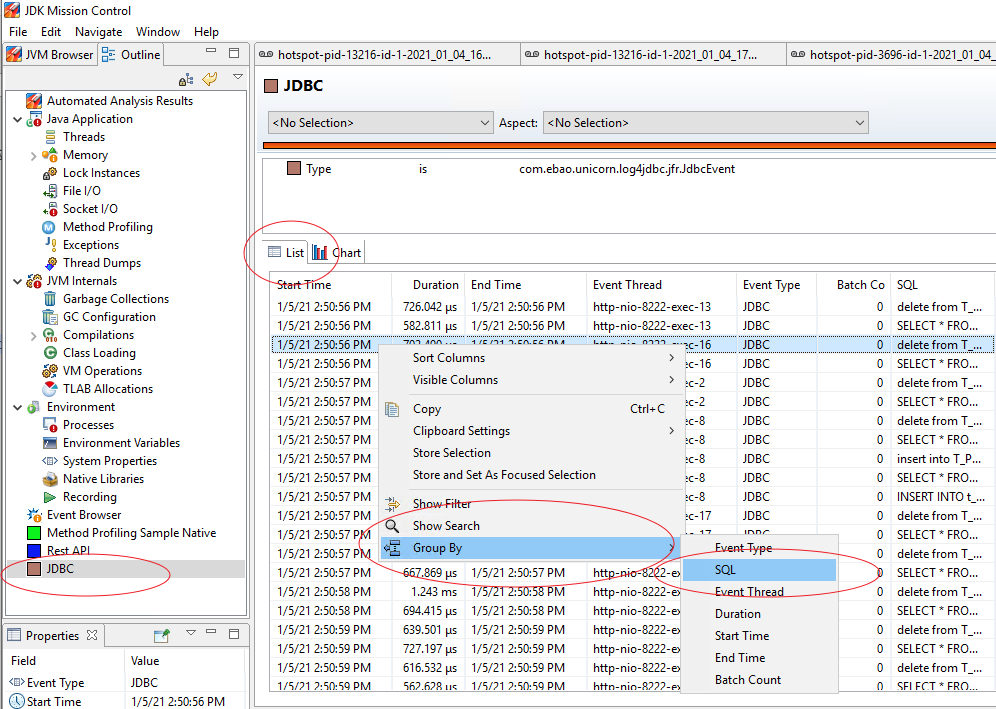
- In the List of the newly created JDBC page, click Group By > SQL in the right-click menu.
- On the SQL Group Statistics Results page, click Visible Columns in the right-click menu, and then select Total Duration and Average Duration.
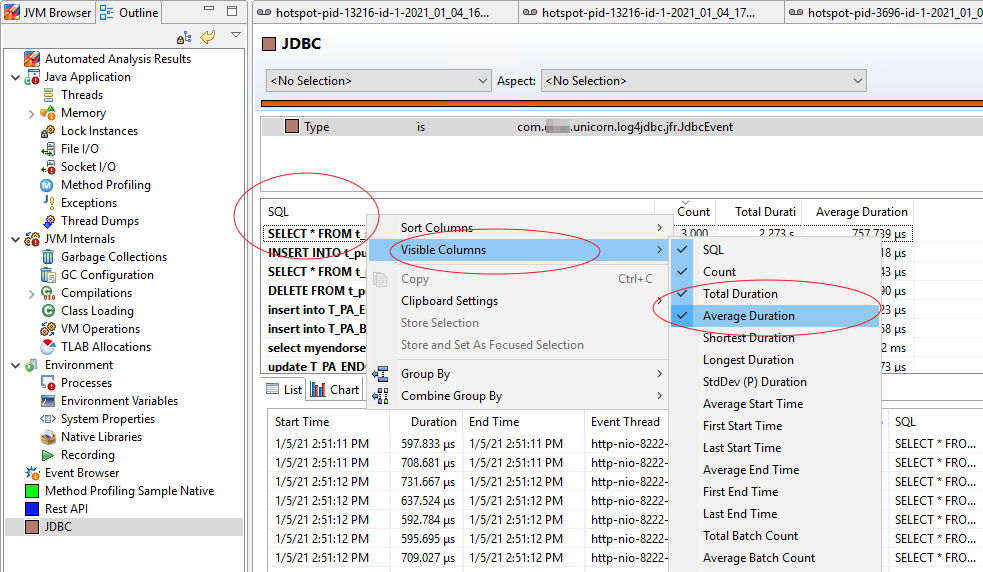
- You can sort operations according to Count, Total Duration, Avg Duration and other dimensions, and you can refer to specific call points after selecting one of the SQL lists.
Rest API Analysis(JMC)
Click Outline > Event Browser. Then find RPC > Rest API in Event Types Tree. The subsequent operation is the same as JDBC Data Analysis (JMC).
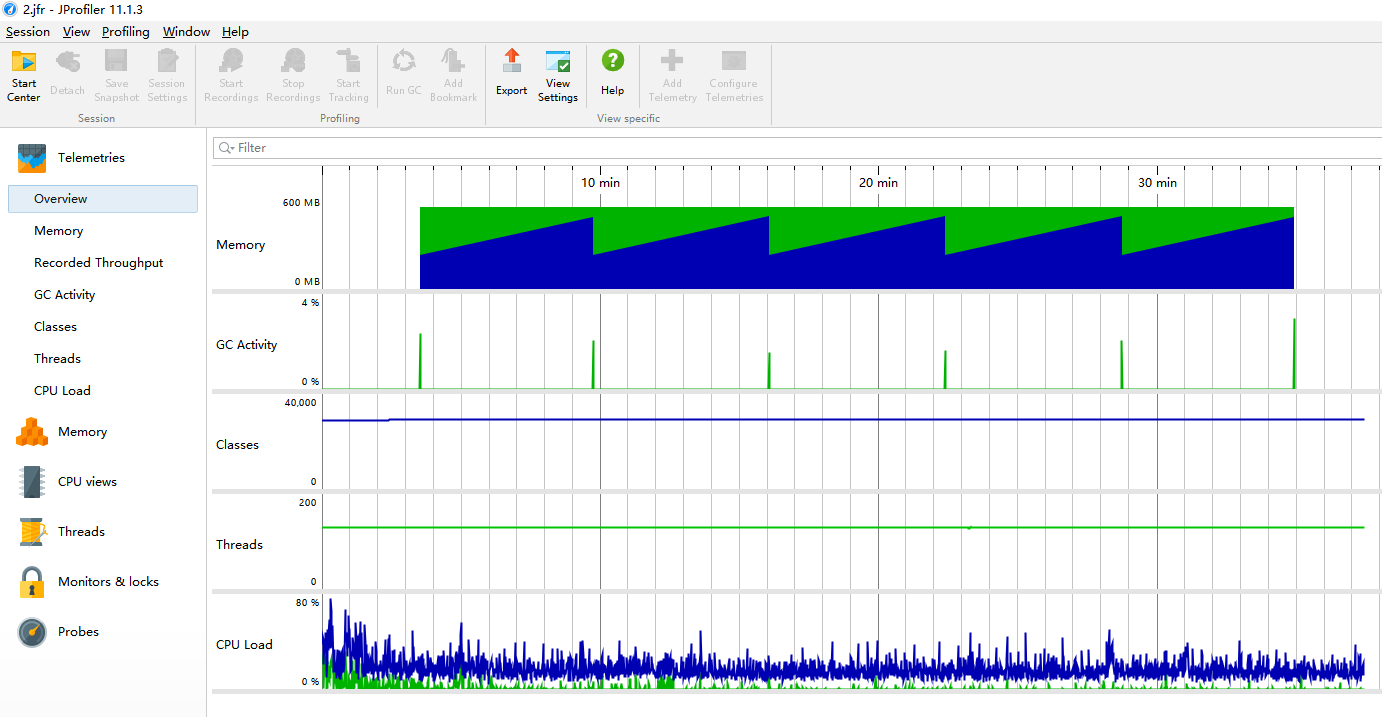
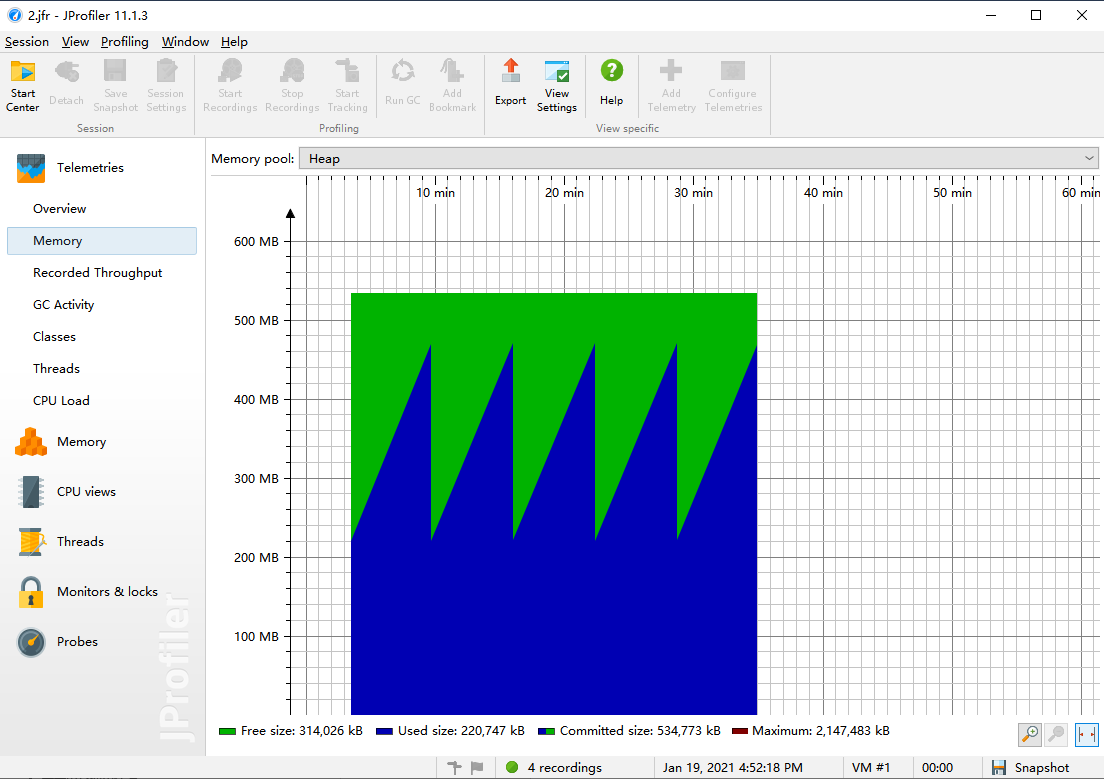
View the Overall Situation of the Resource (JProfiler)
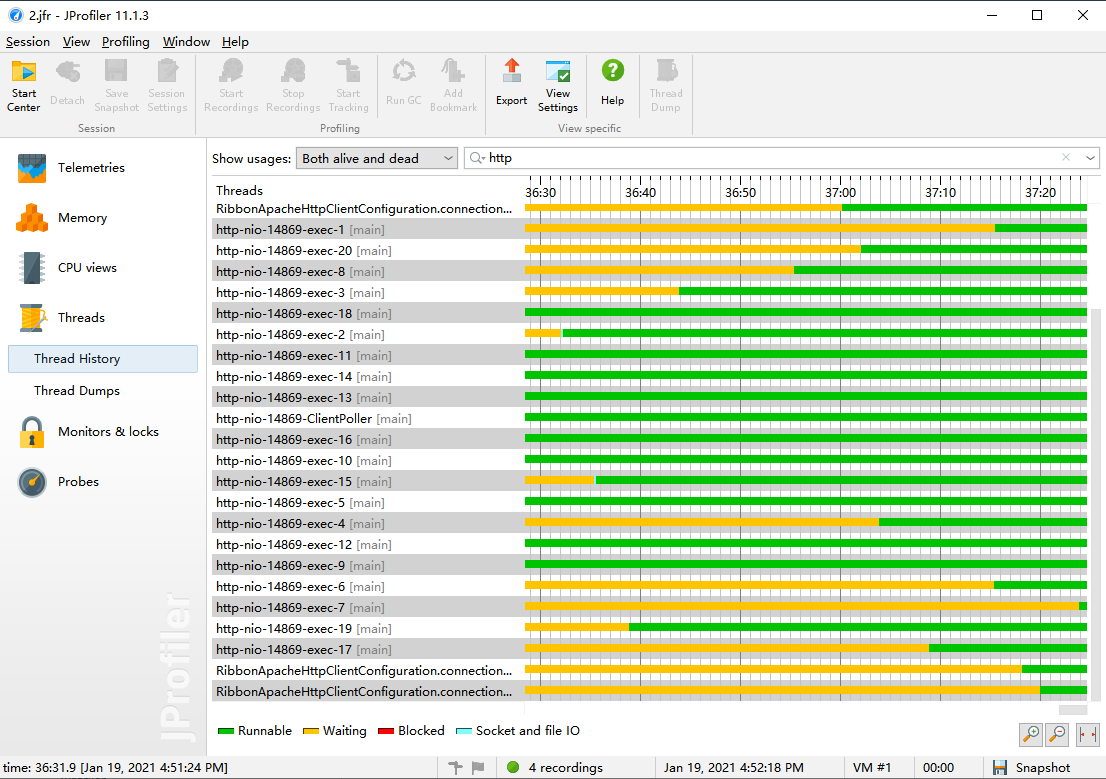
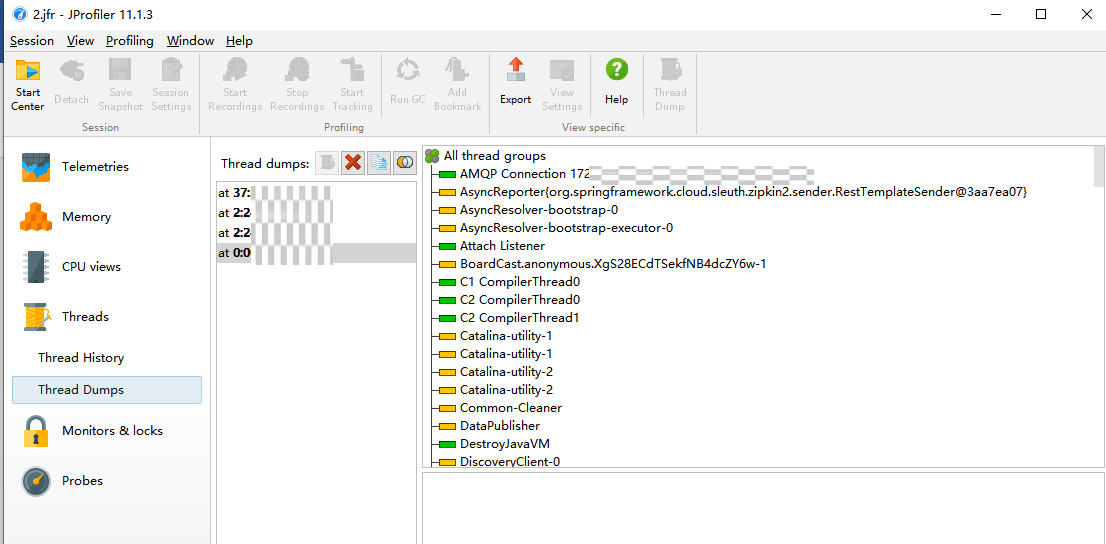
View Thread Status (JProfiler)
View Network Usage (JProfiler)
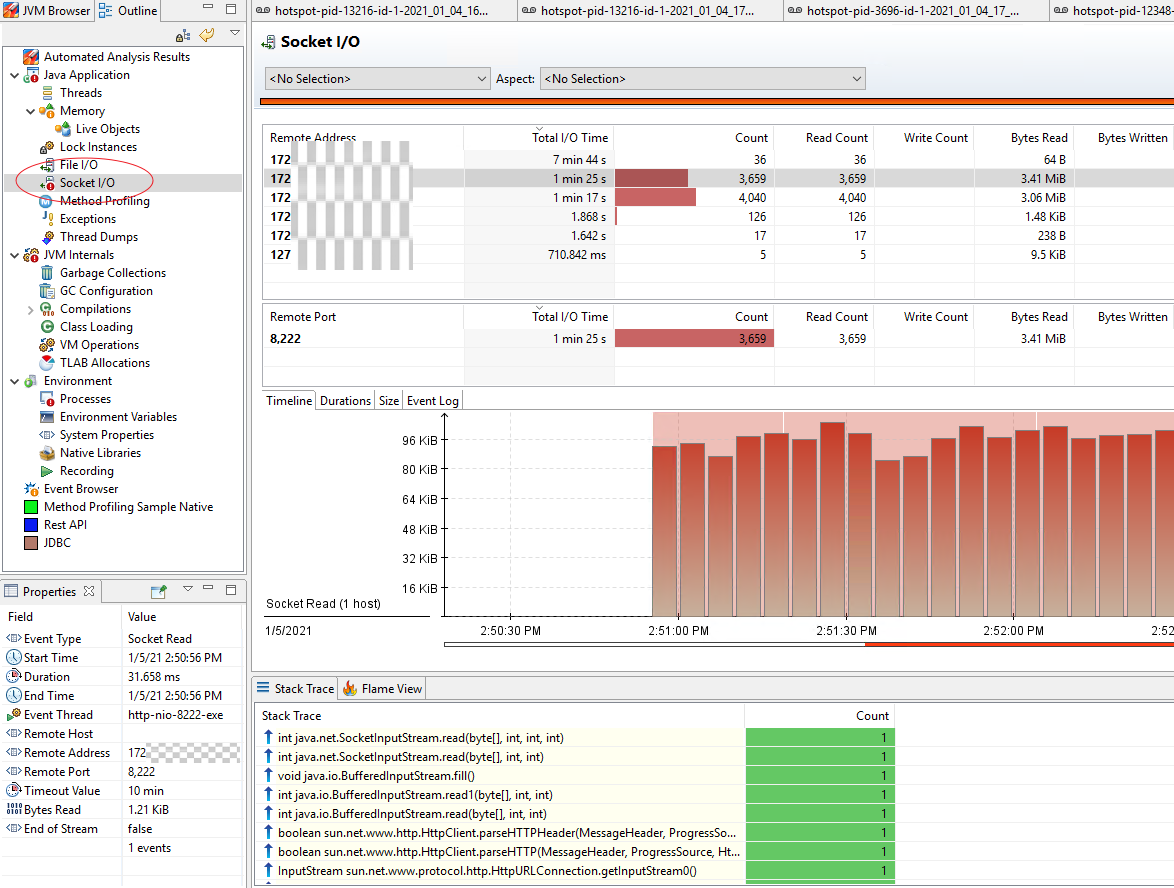
View Network Usage (JMC)
Click Outline > Java Application > Socket I/O to see the network usage. After selecting Remote Address, you can view the detailed data.
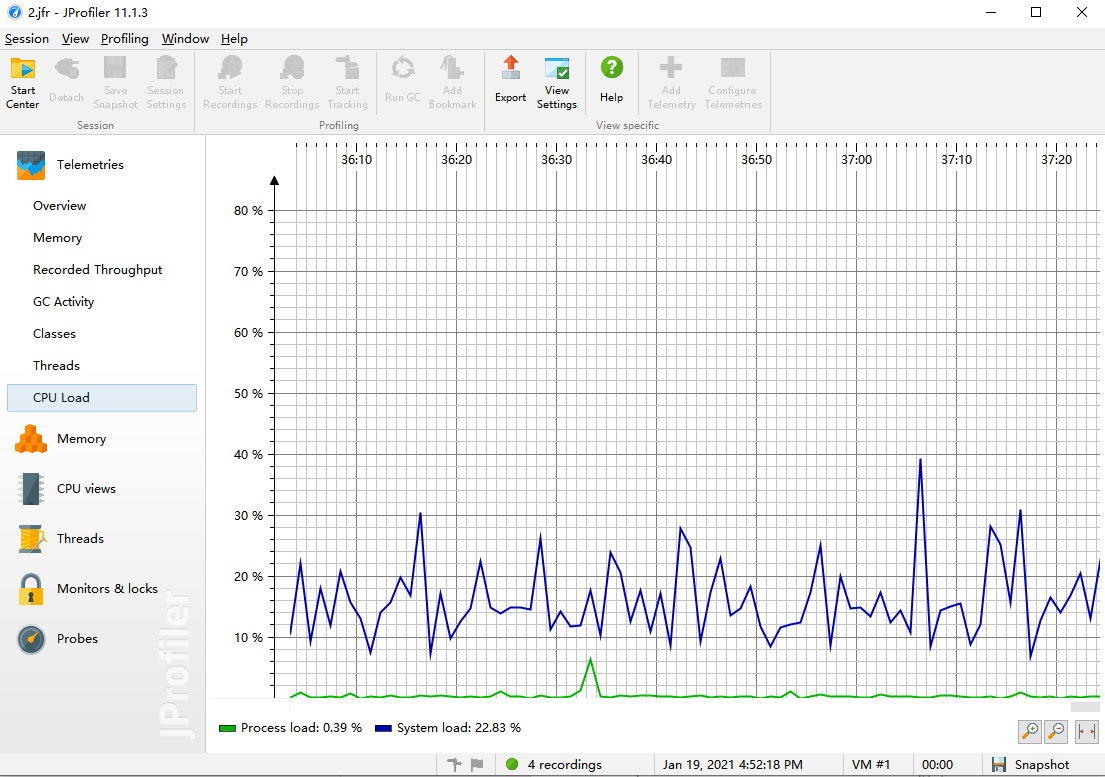
View CPU Usage (JProfiler)
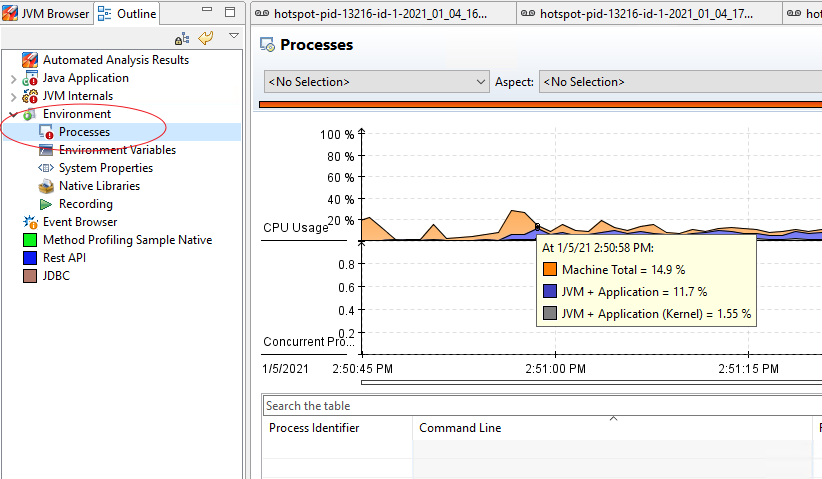
View CPU Usage (JMC)
Click Outline > Environment > Processes. Then you can see the CPU usage.
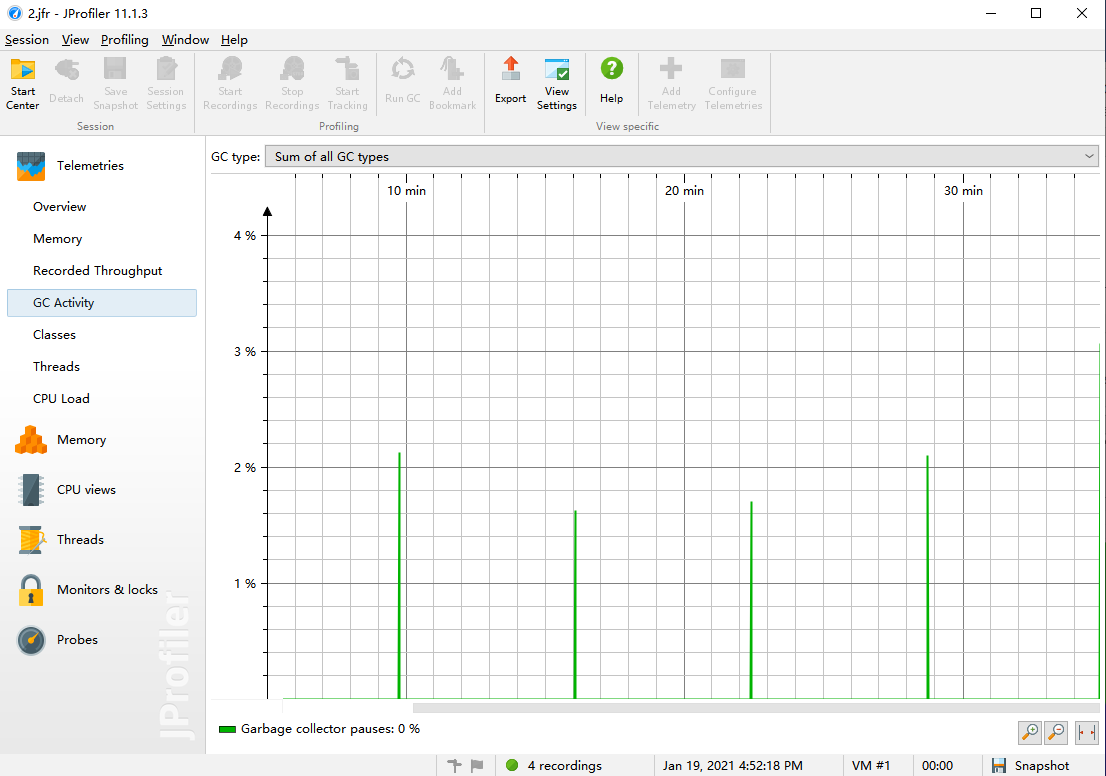
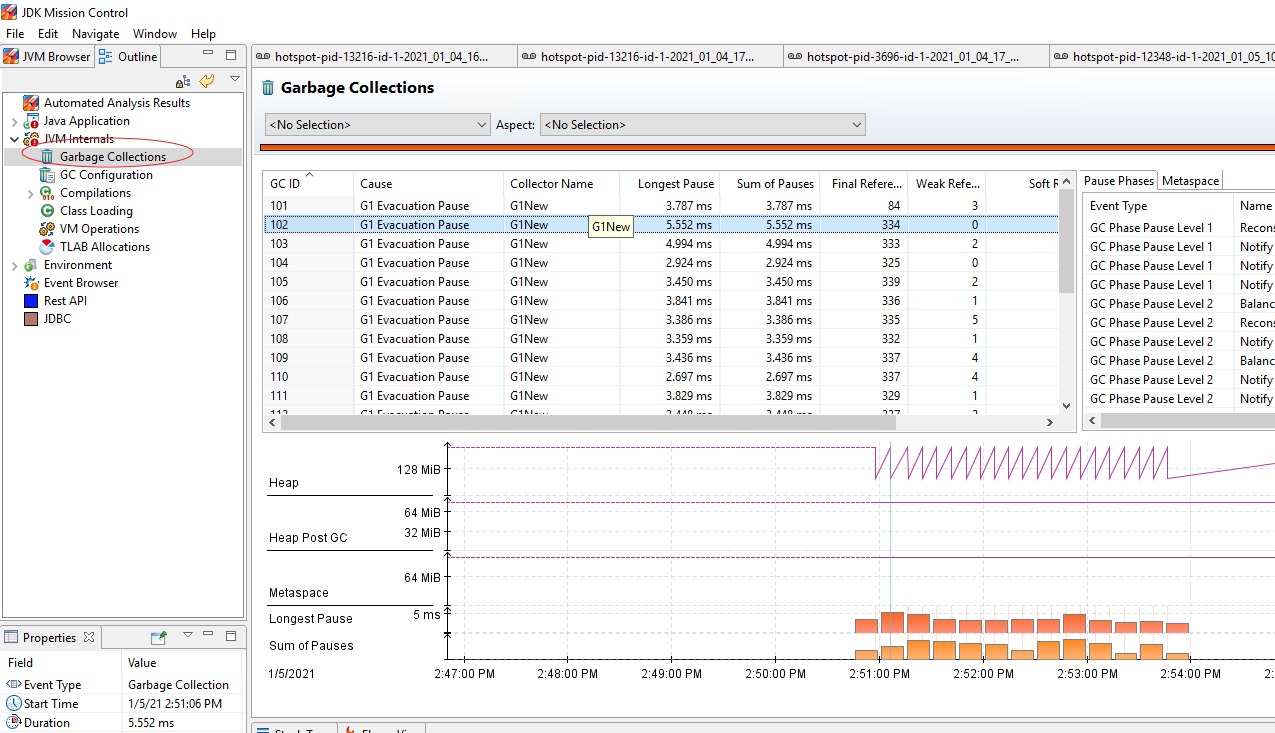
View Memory Usage (JProfiler)
Click Outline > JVM Internals > Garbage Collections. Then you can see memory and GC usage.
Apply Settings
ICS foundation has done the following extension work. If you need to analyze custom functions, you can refer to the foundation’s code implementation.
Rest API Calls
In foundation auto configuration, add interceptors to all created RestTemplates, and log Rest API calls to JFR. No additional configuration is required.
SQL Access
In log4jdbc, StatementSpy or PreparedStatementSpy records the corresponding JDBC events to JFR each time SQL is executed. You need to set the driver of the connection pool to the log4jdbc driver customized by InsureMO in the configuration center.
JDK8 Compatibility Issues
JDK8 does not support JFR-related operations to avoid compilation errors. Instead, a set of mock JFR interfaces and implementations is provided.